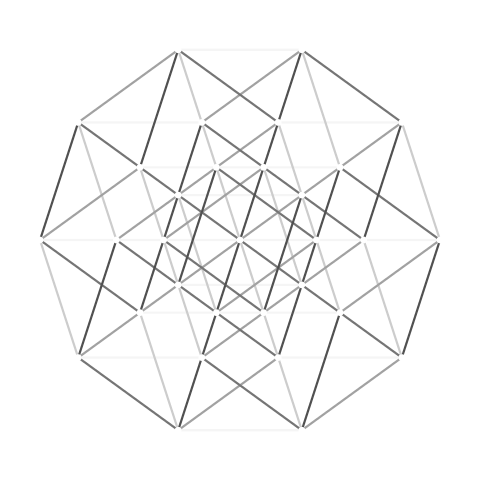
Motion creates the image × This is the oscilloscope idea extended to three coordinates: oscillator outputs determine one moving point. Its recent positions create the visible exposure. Dragging the camera rotates those stored 3D coordinates.
q(t) = ∫ f₀(t) dt
Probability clouds Cloud mode maps three oscillator phases into radial and angular probability quantiles, then converts spherical coordinates to X, Y and Z. Sine amplitudes no longer impose a box. The input density supplies the cloud’s shape; changing scanner speed or phase changes how it is visited. This demonstrates a way to render a given density and does not derive that density from the scan frequencies.
Hydrogen uses nonrelativistic Coulomb orbitals with a fixed point nucleus. Other atoms use hydrogenic radial functions with Slater effective charges and sourced electron configurations. Whole-atom mode averages orientation and weights subshells by occupation, so it is spherical by construction. Individual real orbitals reveal lobes and nodes. Heavy-element densities are especially approximate: no relativistic, many-electron correlation or self-consistent field calculation is performed.
The periodic table mapping There is no single universal “base frequency” for an element. Here the first ionization energy of a neutral ground-state atom defines an energy-equivalent photon threshold fᵣₑ𝒻 = Eᵢₒₙ / h. This is not a spectral emission line or a measured mechanical rotation. Reference rotation uses cosine and sine of that same frequency. Every element therefore traces the same circle at a different rate on a shared time scale.
Spectral trace assigns three neutral-atom transition frequencies to X, Y and Z, with unit amplitudes and chosen phases (90°, 0°, 35°). Those amplitudes, phases, colors and spatial axes are visualization choices. The source lines are not assumed to be phase-coherent. A different assignment produces a different shape. These traces cannot predict molecular stability, bonding, crystal geometry or material properties.
NIST ASD 5.12 supplies ionization energies through Z=108; its theory and semiempirical flags are preserved. For Z=109–118, the file uses explicitly labeled theoretical predictions compiled in Smits et al. (2023), Table 2. Predictions are method-dependent. Hydrogen’s theoretical reference is highly precise; “theoretical” does not always mean poorly known. The selected data and sources are available under Data & equations.
Why the circle appears Equal-amplitude sine and cosine signals at the same frequency satisfy x² + y² = A². Increasing the shared clock repeats the same circle more often. A finite exposure combines the visited positions into a visible ring. With persistence near zero, you see only a short trace. Changing relative frequency or phase changes the path itself.
What “crossing” means here The X, Y and Z signals set simultaneous coordinate values. The guide lines meet at that point. They are coordinate constraints, not simulated collisions between physical waves or calculated interference nodes.
How surfaces emerge The torus and sphere recipes use sums of sine components equivalent to coupled angular scans. Ideal irrational frequency ratios give non-repeating trajectories that can become dense on a surface over time. A finite trace remains a curve; finite point width and display resolution make dense coverage look like a surface. Sphere coverage is not uniform: the trace spends more time near its poles. The volume recipe similarly explores a box-like region. Floating-point ratios approximate irrational numbers.
Clock speed and screen speed The clock can run at 10,000 base cycles per second while your screen refreshes much more slowly. The engine samples the elapsed path inside the exposure interval, rather than drawing only one position per screen frame. When the sampling budget is reached, stratified samples approximate the time exposure; this is not unlimited exact tracking. No straight lines join undersampled points. Point-only mode can visibly alias at high speed.
Color provides a Z-coordinate cue. Each input graph uses its own labeled amplitude scale. Persistence is a finite window with a soft fade. Each sample is weighted by its represented duration and normalized by the window length; brightness and point width are display settings, not calibrated emitted energy. This is a mathematical light trace, not solid matter, an optical hologram, or validation of a chemical or universal physical theory. The screen projects the calculated 3D coordinates into a 2D image.
Recipes and code All shape coordinates are generated by the editable sine sums. The rendering library supplies the camera and point sprites. The earlier material studio and numerical experiments remain available through Earlier lab.
Tektronix · XY displays and Lissajous patterns · Three.js (MIT)